Wealthpath
A personal net-worth tracker and financial-independence planner that works fully offline, derives everything from monthly snapshots, and forecasts with bands instead of single-number fantasies.
“We suffer more often in imagination than in reality.” — Seneca, Letter 13 to Lucilius
Banking apps show balances; spreadsheets show formulas nobody audits; most planners show a single retirement number with false precision. All three ask you to imagine certainty where none exists. This project started from the opposite stance: make uncertainty visible — bands, not points — and derive every number from inputs a human can check.
Two ways to read this page
- Understand the system: The spark ? The struggle ? The decisions ? How it works ? Where it stands ? Reflection.
- Build your own: Constraints ? Architecture ? The snapshot rule ? Try the demo ? The tutorial series ? Exercises at the end.
The spark
I wanted to answer a question my existing tools couldn’t answer honestly: where do I stand, and when can I stop? A bank balance answers the first half for today and nothing else. A spreadsheet answers both halves until one formula rots silently — and spreadsheet rot is silent by design, which is what makes it dangerous for money. So the project began as a requirement, not a stack: monthly truth I record myself, math anyone can re-derive, and forecasts that show ranges instead of pretending to predict markets.
The struggle
The health score I couldn’t explain. The first version computed financial health from allocation heuristics — weights totaling 95, a goal component driven by milestone progress rather than goals. It looked mathematically reasonable and meant nothing I could defend. If you can’t explain what a score means, the score is decoration. It was rebuilt as seven transparent sub-scores (liquidity, savings, debt, emergency, goals, diversification, history) weighting to exactly 100, with tests pinning the near-full and zero states.
Math with no harness. The audit found no test framework installed at all — money code running on hope. The fix was the engine/ split: framework-free pure modules plus 9 vitest files, 40/40 passing. The lesson generalized across every project on this site: untested code isn’t just risky, it’s unteachable.
Two brains, one truth. Snapshots get recomputed on the server and re-derived in the client context. Two paths to the same number is a standing invitation to drift, and the audit flagged it as the top risk. It hasn’t bitten. The parity between the two paths is the thing I would test next, before anything new.
The decisions
Snapshots as source of truth
- Problem
- Net worth must be auditable and recomputable, not a number that drifts.
- Options considered
- Store computed net worth directly
- Derive from monthly per-asset snapshots
- Event-sourced ledger of every change
- Chosen
- Derive from snapshots; history table is a recalculated cache with no write route.
- Why
- Snapshots are human-meaningful (one value per asset per month) and make every derived number reproducible from inputs.
- Trade-offs
- Two recompute paths (server recalc + client context) must be kept consistent; the 2025-09-01 audit flagged this as the top drift risk.
- Result
- Change decomposition (contributions vs growth) falls out for free; export/restore stays coherent.
Seeded Monte Carlo bands instead of point forecasts
- Problem
- Single-number projections pretend certainty the market never offers.
- Options considered
- Deterministic compound projection only
- Monte Carlo with fixed seed
- Full stochastic model with fitted distributions
- Chosen
- LCG + Box-Muller simulation, 1000 paths, p10/p50/p90 output, seed parameter.
- Why
- Seeded runs are bit-identical (measured), which makes statistical code unit-testable; bands communicate uncertainty honestly.
- Trade-offs
- LCG quality is fine for projections, not cryptography; inflation input is computed but not yet wired into the path.
- Result
- ~31 ms per run; UI recomputes per keystroke; tests assert exact outputs.
Four constraints did the rest of the shaping, extracted from the implementation rather than aspired to: zero cloud dependency (Dexie mirror), privacy (SQLite file plus optional self-hosted sync), deterministic tested math (seeded engine), and Excel/CSV import for the messy reality of bank exports. Deployment stays one file plus one command.
How it works
flowchart LR
  subgraph Client["Browser (Next.js App Router)"]
      UI["15 pages + components"]
      CTX["NetWorthContext + React Query"]
      BR["local-bridge.ts"]
      DEX["Dexie / IndexedDB"]
  end
  subgraph Server["Next.js server"]
      R["21 API route files"]
      DB[("networth.db")]
  end
  PG[("PostgreSQL (sync only)")]
  UI --> CTX --> BR
  BR -->|server mode| R --> DB
  BR -->|local mode| DEX
  R -->|push/pull LWW| PG
The bridge interposes on fetch; the engine computes; snapshots are the source of truth.
The file to understand first is local-bridge.ts: every data request passes through it, and it routes each call either to the API routes (server mode) or to Dexie (local mode). One UI, two backends, zero rewritten components when switching. The file to understand second is src/lib/engine/: framework-free math — health, projections, scenarios — with no imports from the app, which is exactly why it can be tested in milliseconds and reasoned about on paper.
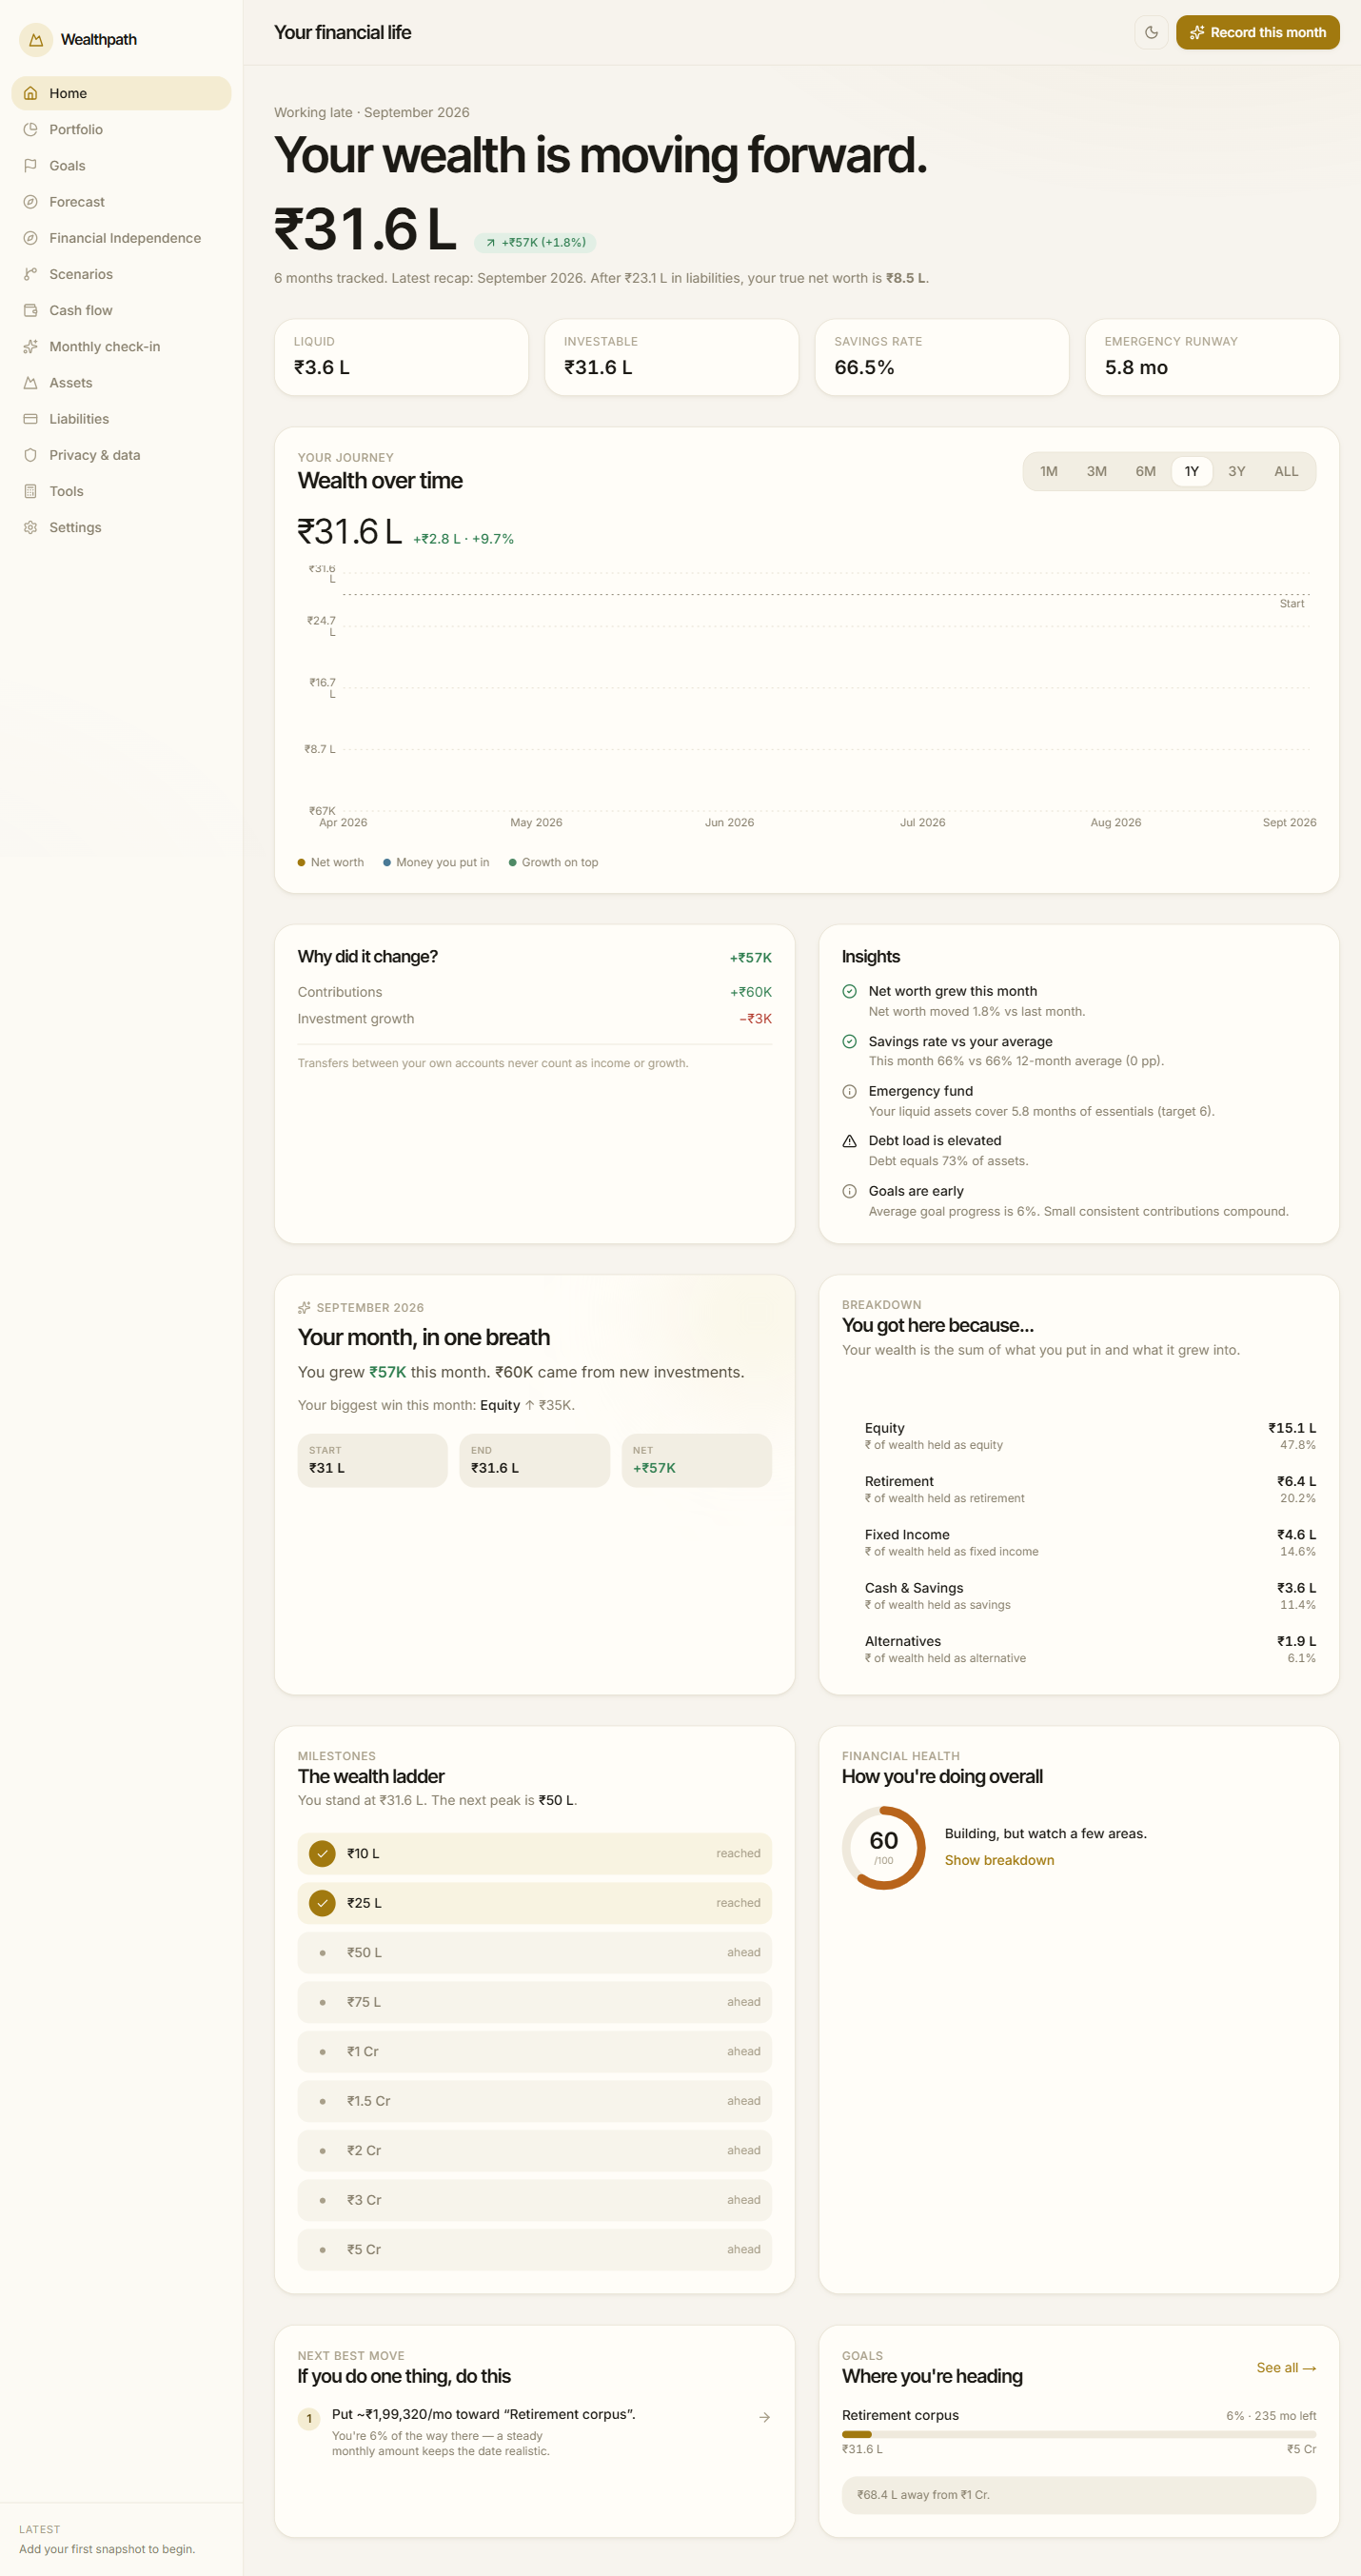
The monthly check-in wizard is where truth enters: per-asset values, once a month, becoming snapshots. Everything downstream — net worth, journey chart, runway, Monte Carlo bands, what-if scenarios — derives from those rows. Delete every derived table and the app rebuilds them; delete the snapshots and there is nothing. That asymmetry is the whole design.
flowchart TB
  S["Monthly snapshots (you enter)"]
  S --> N["Net worth"]
  S --> H["History cache (recalculable)"]
  S --> J["Journey chart"]
  S --> R["Runway"]
  S --> M["Monte Carlo bands"]
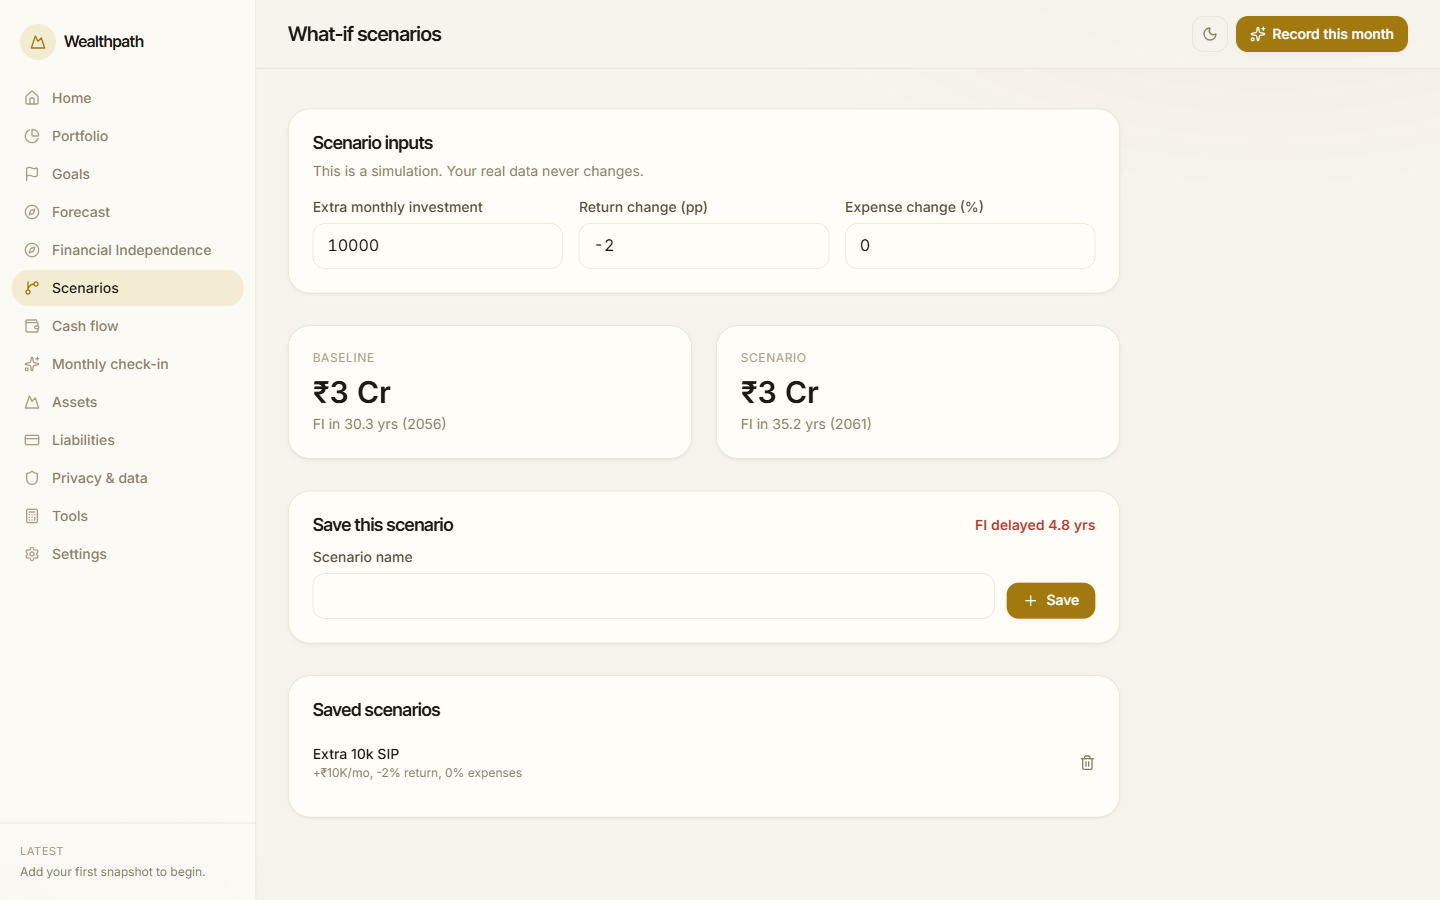
  S --> SC["What-if scenarios"]
One source of truth, six derivations. The history table has no write route — it is a cache the app recomputes. This is the diagram to hold against any finance app: which box is the truth, and what happens when you delete the rest?
flowchart LR
  SE["Seed"] --> LG["LCG + Box-Muller"]
  LG --> P["1,000 paths"]
  P --> Q["p10 / p50 / p90"]
  Q --> B["Bands, not points"]
Structure only, not measured output: a fixed seed makes the simulation bit-identical across runs (measured), which is what makes statistical code unit-testable. Measured cost (~31 ms per run) is in the verification table below.
In action
Screenshots and video captured from a live local run against fictional demo data (verified 2026-09-04). No real financial figures appear anywhere on this page.
In action

Video walkthrough
Where it stands
| Verified | 40/40 vitest (2026-09-04); seed determinism bit-identical across runs; ~31 ms per 1000-path run; 21 API route files; 3 screenshots + narrated video from live runs |
| Observed | UI recomputes projections per keystroke without perceptible lag; offline mode indistinguishable from server mode in normal use |
| Intended | Server/client recompute parity tests; inflation wired into Monte Carlo paths |
| Unknown | Multi-year dataset performance; sync-conflict behavior beyond last-write-wins |
| Check | Result | Date |
|---|---|---|
| Unit tests (vitest) | 40 / 40 passing | 2026-09-04 |
| CRUD smoke (project docs) | 25 / 25 passing | per TEST_SUMMARY.md |
| E2E scripts | smoke, import, full, prod present | in repo |
| Seed determinism | bit-identical across runs | measured 2026-09-04 |
| Monte Carlo cost | ~31 ms per 1000-sim run | measured 2026-09-04 |
Unit and determinism figures were executed for this case study; smoke figures are quoted from project docs as point-in-time.
How help was used, and where judgment stayed
No agent workflow is recorded in this repo’s history — no instruction files, no task reports — so the honest statement is that the judgment trail lives in the audit and the rebuild it triggered: foundation before features, engine split before new screens, tests before trust. The deterministic design is itself AI-era-proofing: seeded, pure, exactly-asserted math is checkable by anyone or anything, while the two-path drift risk above is precisely the kind of thing no agent would flag unprompted. Verification here is mechanical: 40 green tests, bit-identical seeds, screenshots from live runs.
Reflection
What worked. Snapshots-as-truth survived contact with every feature — scenarios, export, forecasts all derive cleanly. Seeded randomness made statistics testable, which still feels like a trick worth stealing.
What didn’t. Health v1 (a score I could not defend), untested math (fixed by the split), and the standing two-path drift risk (acknowledged, untested — the next test to write).
What surprised me. How little of a finance app is finance: most of the work is input plumbing, state sync, and import parsing. The money math is the small, dense center.
What I’d change. Wire inflation into the Monte Carlo paths; write the server/client parity test; then stop adding features until a real year of snapshots exists to learn from.
Project timeline
- 2025-09-01Architecture audit written
Ten-item debt list, target engine layout, phase order: foundation before features.
- After auditP1 foundation lands
engine/ split plus 9 vitest files; health score rebuilt as v2.
- 2026-09-04Independently verified
40/40 tests re-run, app executed locally, screenshots and narrated video captured from live runs.
Build your own
Reproduce: clone, install, seed the demo data, run the tour. Modify: change one engine weight and watch which screens move — then decide whether the movement is correct. Extend: wire inflation into the Monte Carlo path (the open wiring, documented above). Re-design: replace snapshots with an event ledger and feel, concretely, what auditability costs. The six-part tutorial series reconstructs this project layer by layer — start with Part 1: problem and architecture.
Tutorial series
networth-app
- Part 1: The problem: a net-worth tracker that works offline and tells the truth
- Part 2: The calculation engine: small math modules you can trust
- Part 3: API and persistence: what happens when you click Save
- Part 4: Client tour: pages, shared state, and the app shell
- Part 5: Offline and sync: how the app works with no server
- Part 6: Capstone: the full picture, the vocabulary, the principles